

20 July 2026
Public aquariums: what the water microbiome can reveal
A longitudinal survey of six freshwater exhibits shows how water microbiome profiles may complement health surveillance without replacing clinical assessment or targeted diagnostics.
- Sector
- Public aquariums
- Themes
- Water qualityDiagnostics
- Animal groups
- Fish
- Content type
- Scientific news
An aquarium can remain within its expected ranges for pH, temperature, dissolved oxygen and nitrogen compounds while its microbial community is changing underneath those routine measurements. A study published in May 2026 followed water microbiomes in six freshwater exhibits at River Wonders, Singapore, for eight weeks. Some of the least stable profiles occurred in exhibits where fish were already showing poorer health. The work supports a promising non-invasive surveillance layer, but it does not establish a stand-alone diagnostic test or a universal dysbiosis threshold.
A time series across six contrasting exhibits
The researchers operationally classified three exhibits as “Healthy” and three as “Stressed”. The categories integrated veterinary observations, previous disease events and husbandry records. Healthy exhibits had no notable clinical signs, outbreaks or unusual mortality during monitoring; stressed exhibits included fish with visible lesions or abnormal pigmentation. No standardised quantitative health score was available across systems, so the labels should not be read as a formal epidemiological case definition.
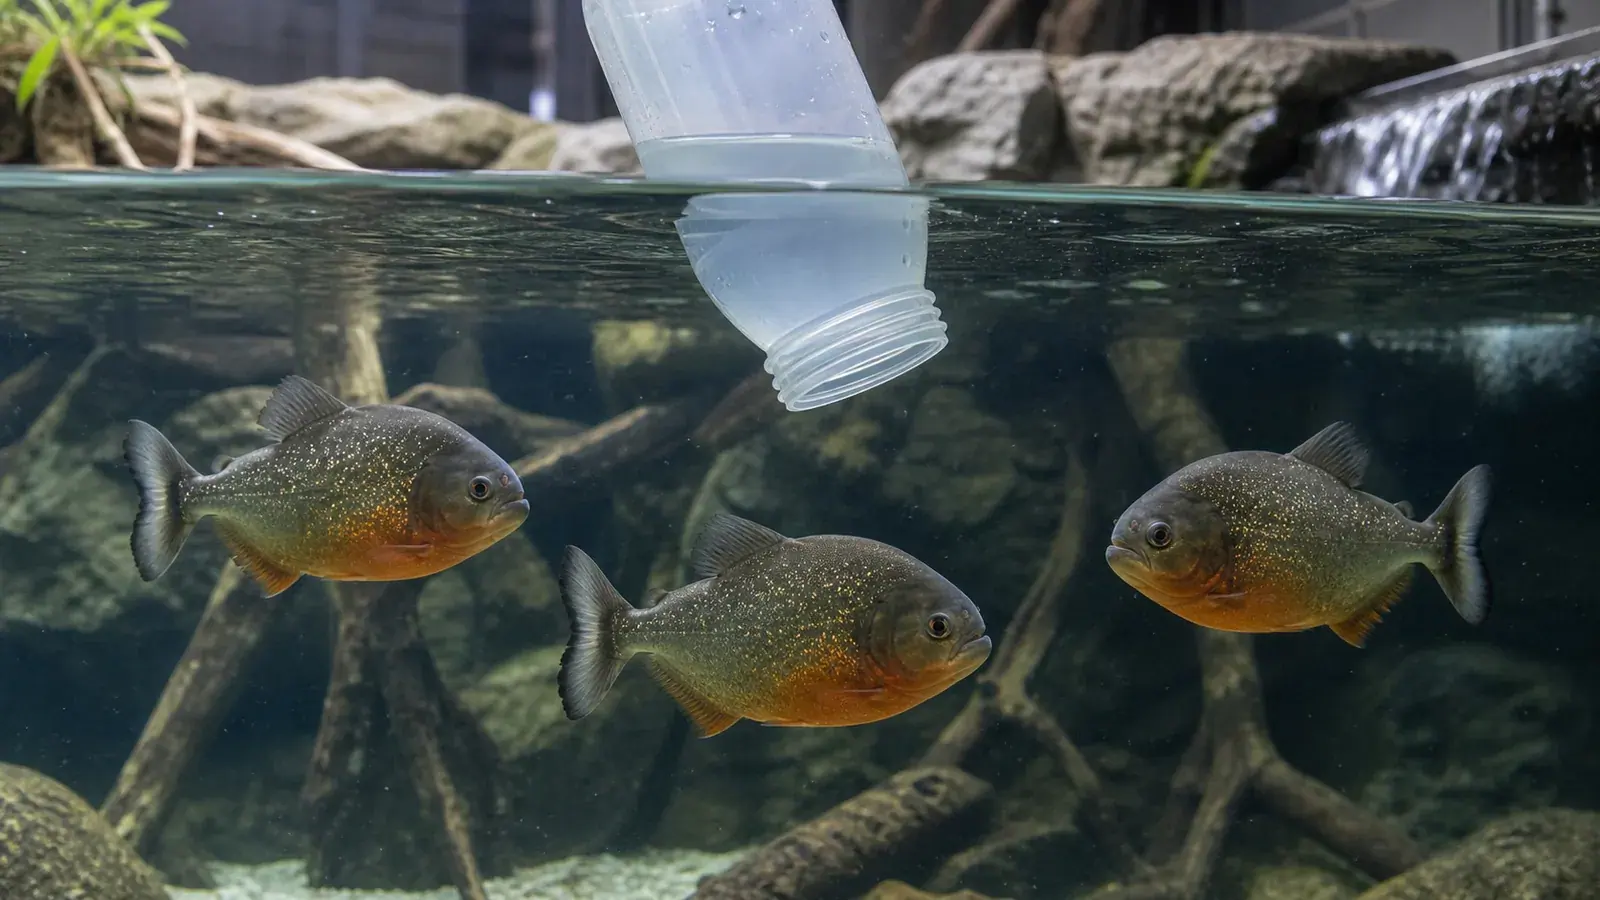
The collection covered very different settings: three red-bellied piranhas in one exhibit, 31 rainbowfish in another and 471 fish from 25 species in a large outdoor exhibit. The other systems represented Lake Malawi and Mekong communities and an electric-eel display. Three systems were closed and indoors, two were semi-indoor and one was fully outdoors. This diversity is professionally realistic, but it also means that simple tank-to-tank comparisons carry substantial confounding.
From 21 September to 16 November 2023, weekly water samples were taken at three spatially distributed points in each exhibit. Extra samples were collected around routine work, including 5–20% partial water changes, sand vacuuming and glass cleaning. In total, 186 samples yielded 17,176,734 high-quality reads, averaging 92,348 reads per sample.
The team amplified the V3–V4 regions of the bacterial 16S ribosomal RNA gene and clustered sequences into operational taxonomic units at 97% similarity. This approach mainly describes relative abundance and generally resolves bacteria to genus level. It cannot, by itself, show that an organism is alive, virulent or responsible for a lesion.
Instability mattered more than a single organism
Microbial composition varied by date, exhibit and indoor versus outdoor design. The piranha and rainbowfish exhibits, both classified as stressed, shared fewer operational taxonomic units across sampling dates, suggesting reduced temporal stability. The piranha system also produced the most dispersed community trajectory in the overall ordination.
Its sharpest event was a transient Pseudomonas bloom representing 51.4% of sequences, compared with less than 0.4% at most other time points. The bloom coincided with a decline in the nitrifying genera Nitrosomonas and Nitrospira. In the rainbowfish system, Aeromonas remained between 1.5 and 5.6%, while Flavobacterium reached 8.7 and 9.0% in two consecutive sampling weeks. In the large outdoor community, Pseudomonas reached 30.1% during one event alongside Flavobacterium at 4.6%.
These genera contain opportunistic or pathogenic species, but a genus name is not a diagnosis. Disease-associated genera also occurred in exhibits classified as healthy. Edwardsiella, for example, reached 13.7% in the electric-eel exhibit without placing that system in the stressed category. Any abundance must therefore be interpreted alongside clinical signs, mortality, system history, water quality and targeted diagnostic evidence.
Maintenance was followed by change, not proven to cause it
After observed maintenance events, bacterial richness increased by approximately 1.0–2.2-fold and Shannon diversity by 1.0–1.6-fold, depending on the exhibit. Several relative abundances fell. In the piranha exhibit, Pseudomonas declined from 4.5 to 0.1% and Mycobacterium from 10.6 to 0.7%; in the outdoor system, Pseudomonas declined from 13.0 to 8.3%.
These before-and-after comparisons were limited. Interventions were neither randomly assigned nor tested as replicated controlled treatments. The data demonstrate temporal association, not the causal effectiveness of a defined procedure. They do not justify a universal water-change percentage or disinfection based solely on detecting a taxon. Excessive intervention could disrupt biological filtration or shift rather than solve the underlying problem.
Designing a surveillance programme that can be interpreted
The first practical step for a public aquarium may not be purchasing sequencing. It is making existing information comparable: sampling time and location, temperature, pH, dissolved oxygen, ammonia, nitrite, nitrate, animal load, feeding, cleaning, introductions, treatments, clinical observations and mortality. A microbiome result without this timeline loses much of its value.
Where 16S monitoring is introduced, each exhibit should initially serve as its own baseline. Profiles differed strongly among the six systems, making a universal list of “good” and “bad” bacteria misleading. A regular series collected under a stable procedure can instead reveal departures from an exhibit’s customary range and trajectory.
A signal should trigger a graduated investigation. Teams can verify physicochemical parameters and recent events, intensify animal observations and review mortality trends, then select culture, species-specific PCR, histopathology or veterinary sampling when warranted. Community sequencing can direct attention; it cannot replace species- or strain-level identification or prove causality.
Sampling design also needs quality controls. The published project did not include extraction blanks or reagent-only controls, and its OTU pipeline offers less sequence resolution than current amplicon-sequence-variant approaches. A service specification should therefore document negative controls, sample storage, sequencing batches, bioinformatic versions and how low-abundance findings will be handled. Consistency is essential if a trend is expected to support operational decisions.
Staff biosecurity belongs in the same plan. Recurrent Mycobacterium detection in some closed systems did not prove fish mycobacteriosis, but it reinforces the value of suitable gloves, covered skin breaks, clean sampling procedures and a defined response when clinical suspicion is present.
Conclusion: follow the trajectory, not an isolated number
This study does not create a new compliance limit. It shows that each exhibit’s microbial community has a history and that some disruptions may accompany deteriorating animal health or ecological imbalance. Its practical value comes from convergence: microbiome, water chemistry, animal observations and husbandry events interpreted together.
Vetofish can support public aquariums in designing sampling plans, structuring metadata, defining alert levels and connecting environmental findings to a veterinary diagnostic pathway. The aim is to identify drift earlier while avoiding the mistake of treating relative abundance as disease.
References
- Shen, X., Yu, F. X. D., Xie, S., Hsu, C.-D., Domingos, J. A. & Gibson-Kueh, S. (2026). “Temporal microbiome dynamics and fish health-associated dysbiosis in freshwater aquarium systems: a case study from River Wonders Singapore.” Frontiers in Microbiology, 17, 1739391. https://doi.org/10.3389/fmicb.2026.1739391
- National Center for Biotechnology Information (2026). BioProject PRJNA1290883, 16S rRNA gene sequence data associated with the study. https://www.ncbi.nlm.nih.gov/bioproject/PRJNA1290883
- Smith, S. A. (2023). “Fish Welfare in Public Aquariums and Zoological Collections.” Animals, 13(16), 2548. https://doi.org/10.3390/ani13162548