

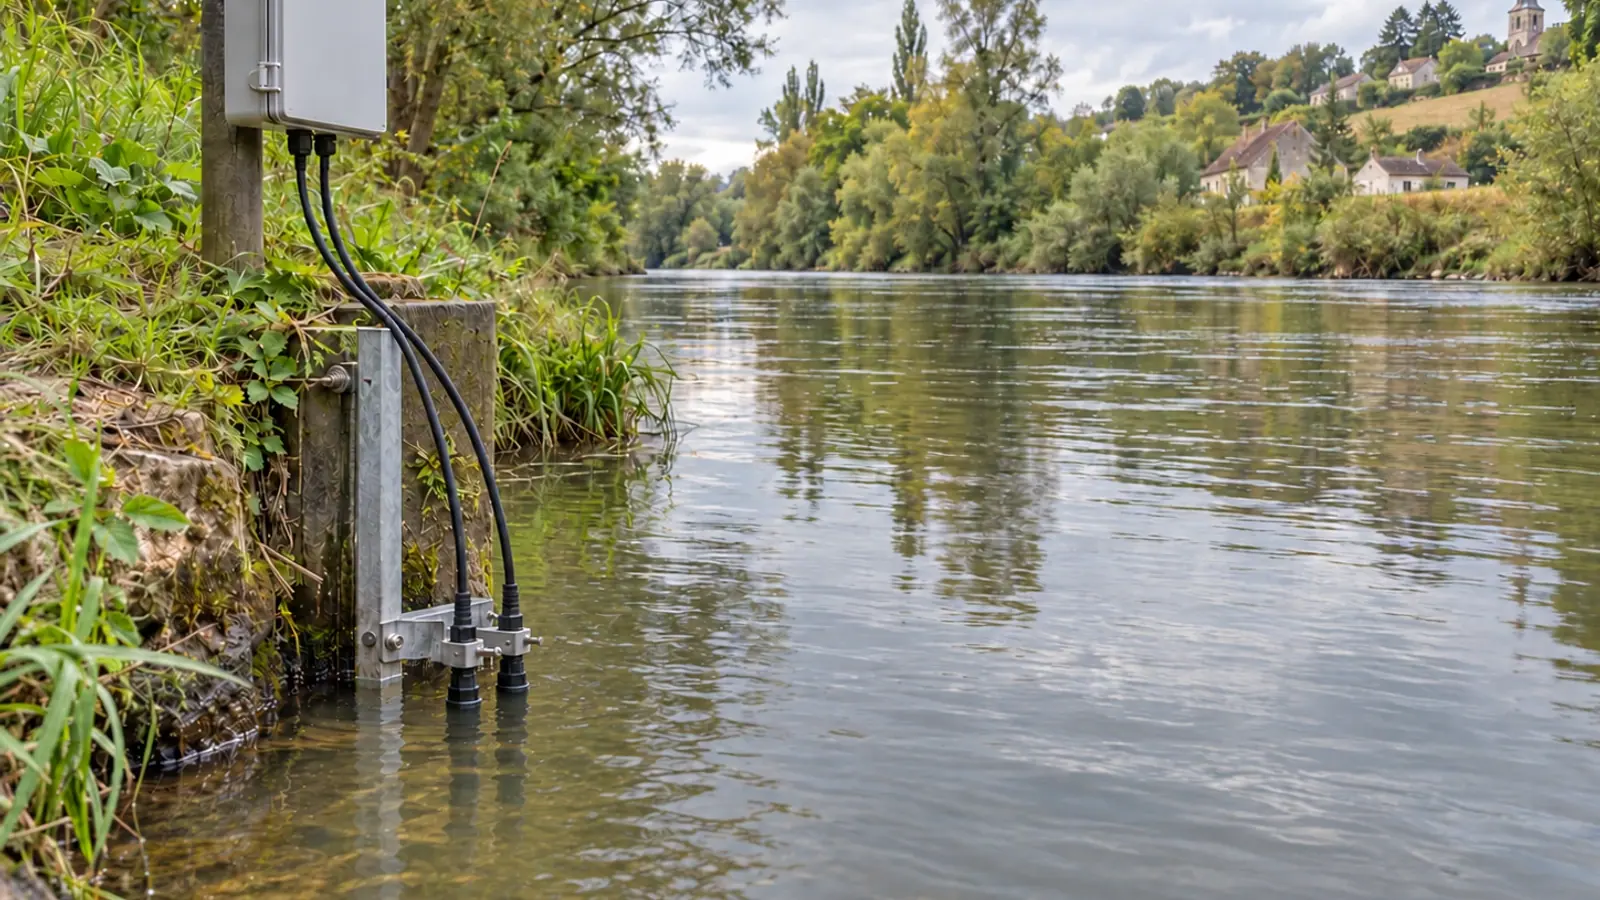
River turbidity: a new sensor can break comparability
A step in a turbidity record does not always mean the river has changed. USGS laboratory and field comparisons published in 2021 show that sensor design and calibration standard can affect readings. Replacing equipment calls for documentation and, where possible, a site-specific comparison.


- Content type
- Practical guide
- Sector
- Environment
- Animal group
- Fish
- Keywords
- TemperatureOxygenpH
A break in the record can originate in the equipment
Turbidity is an optical response of water, influenced by particles that scatter light. River records can reveal changes associated with hydrological events, but the reading also depends on how an instrument illuminates and observes the water volume. Replacing a sensor partway through a record can consequently change the numbers without a corresponding proportional change in the river.
A 2021 USGS technical report by Foster and colleagues examined this issue by comparing two sensor models and calibration standards in laboratory and field settings in the United States. It provides evidence for planning an equipment transition. It did not measure fish health or establish a biological harm threshold.
Before attributing an apparent increase to river works, a flood or a new pressure, a manager needs to check whether the instrument changed. The instrument history is part of the evidence needed to interpret a long-term environmental trend.
What the comparison programme covered
The programme included nine field comparisons of YSI EXO and YSI 6136 sensors at sites in Kansas and Virginia. Two further field comparisons examined different standards used to calibrate EXO sensors. Laboratory work comprised five sensor comparisons and seven calibration-standard comparisons. These are different comparison designs, not a sample size of fish.
Field tests lasted from two weeks to nine months, with data recorded at fifteen-minute intervals. Instruments were positioned close together and synchronised to observe conditions as consistently as possible. Laboratory tests used different suspensions, including clays and material collected from natural waters.
That range matters because response to a calibration standard need not reproduce response to a river suspension. Particle size, colour and distribution can affect a reading. The programme also examined different batches of calibration standard, reinforcing the value of retaining their references with the instrument records.
Strong correlation does not mean equal readings
The authors generally found strong linear associations between the records being compared. However, these relationships were not always one-to-one. Two sensors can track the rise and fall of the same event while returning different numbers at a given time.
The report does not support one correction applicable to every sensor, standard and water matrix. Differences varied between laboratory and field conditions. The authors also warn that correcting one record to resemble another can introduce error that is difficult to quantify.
We therefore recommend separating two questions. Do the instruments follow the same changes, and are their values sufficiently comparable for the intended use? The answer depends on the monitoring objective. Detecting an event and comparing a trend across many years do not necessarily require the same demonstration of continuity. A correlation coefficient alone cannot settle both questions.
Design a useful period of overlap
Where equipment and scheduling allow, running the old and new sensors simultaneously provides a basis for local comparison. The overlap should aim to cover conditions relevant to the site. A quiet period does not automatically describe response during major sediment resuspension. The report recommends comparison across a range of conditions rather than inferring a single bias from one isolated situation.
The observation locations and water volumes also need to be comparable. Nearby probes can still encounter different particles, bubbles or fouling. Their averaging settings and clocks should be documented. During a rapid discharge change, a timing mismatch can otherwise appear to be disagreement between instruments.
Additional sampling, designed around the monitoring question, may help characterise the conditions encountered. Turbidity is not, however, a suspended-solids concentration expressed in milligrams per litre. Relating the two requires validation for the local matrix and cannot be achieved through a general unit conversion. A relationship established elsewhere should not be transferred without examination.
Keep the equipment change visible in the metadata
The station log should retain replacement dates, sensor models and identifiers, calibration products and batches, settings, verification and maintenance. Original measurements need to remain retrievable with their methods. If a corrected series is produced, it should be distinguishable from the source readings and accompanied by an explanation of the processing.
Turbidity units are connected to optical methods. Copying the unit shown on a display is not sufficient to establish equivalence with another record. Before combining data, check the measurement characteristics and the way the method is declared in the database. A general conversion factor should not be invented to bridge an undocumented equipment change.
Biological interpretation remains a separate task. Temperature, dissolved oxygen, pH, habitat and field observations may all provide essential context when the question concerns fish. The USGS comparison did not establish a turbidity value that guarantees absence of risk for a species or life stage. Better measurement traceability makes observations more interpretable; it does not provide a clinical diagnosis.
Absence of an overlap period should also remain explicit. A retrospective dataset may still be useful, but its interpretation must account for the point at which method comparability became uncertain. Making that limitation visible is preferable to silently joining two records and presenting the change as wholly environmental.
Conclusion: record the transition to protect interpretation
A new sensor may improve the monitoring equipment while still requiring a careful data transition. Retaining its history, comparing instruments under relevant conditions and describing the limits helps prevent an instrumental discontinuity from becoming an unsupported ecological conclusion. The intended use of the record should guide the assessment.
Structuring monitoring with Vetofish
Vetofish can help connect aquatic-fauna monitoring objectives with measured parameters, prepare records for an instrument change and discuss observations with instrumentation specialists. This support complements specialist validation of conversion models and the hydrometric expertise of the monitoring network.
To move from evidence to action, explore our advice and support service and our expertise in aquatic environmental health.


