

Salmonid habitats: tracking thermal contrasts around dams
A stream can develop lower daytime peaks without a lower daily mean. A 2017 Oregon study separated this buffering from local cool patches associated with groundwater exchange. Assessing salmonid habitat requires observations at both reach and channel scales.

- Content type
- Practical guide
- Sector
- Environment
- Animal group
- Salmonids
- Keywords
- TemperatureOxygenStress
A single temperature reading can miss two different features of a stream: how extremes vary through the day, and whether cooler patches occur within the channel. Nicholas Weber and colleagues examined both at Bridge Creek in Oregon in a study published in 2017.
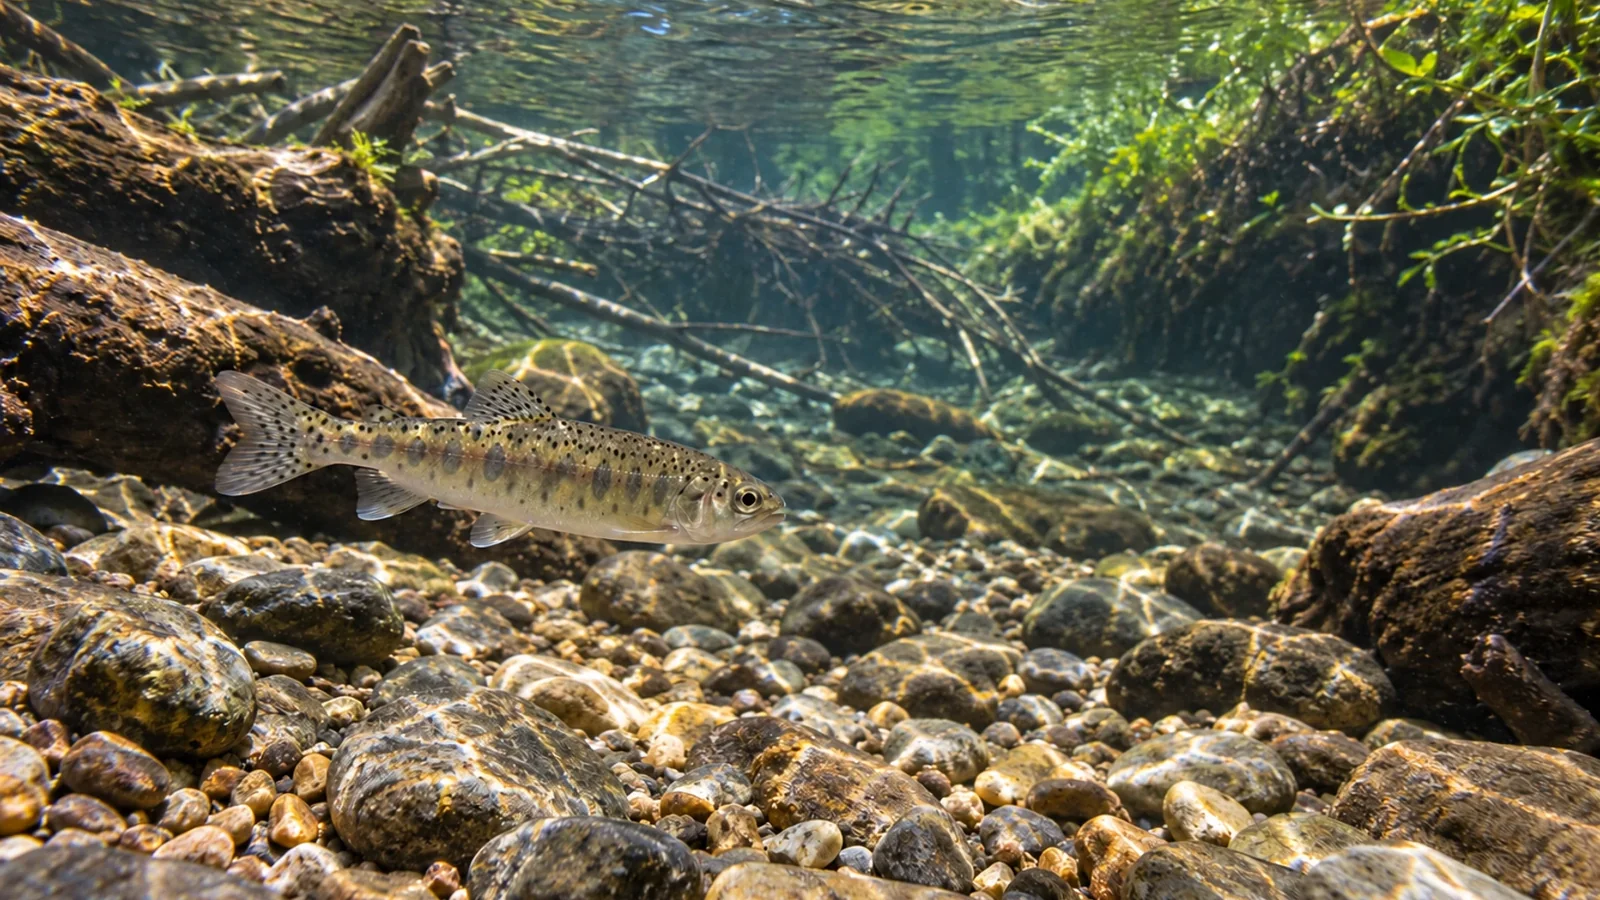
The stream supports Oncorhynchus mykiss, including a steelhead population, the migratory form of rainbow trout. The paper concerns their thermal environment. Its temperature analysis did not directly measure an improvement in fish survival, and does not provide a restoration recipe transferable to every river.
Long-term records and a separate local survey
The researchers monitored beaver dams and temperature along 34 kilometres between 2007 and 2014. Intact natural dams increased from 24 to 120. Beaver dam analogue structures had also been installed in selected reaches to support restoration processes. The study therefore included both natural activity and a managed intervention.
Installed analogue structures were not automatically counted as active dams. Relevant analyses included those that beavers were maintaining. Distinguishing structures installed from structures functioning under the observed conditions prevents the intervention count from being mistaken for the amount of active water retention.
Temperature monitoring covered 23 locations, including four long-term stations. Three were downstream of areas where dam abundance increased; the fourth, upstream of that activity, served as a control. A finer-scale campaign in 2015 then examined near-bed temperature differences across sections only a few tens of metres long.
Lower peaks did not imply a lower daily mean
For the long-term stations, the authors compared 2007–2010 with 2011–2014, expressing affected stations relative to the control. This before-after comparison with a control sought to account for climatic differences between years. The reported changes were therefore not simply two isolated readings taken before and after construction.
At river kilometre 6.16, the relative summer daily maximum fell by 2.56°C between the two periods. The relative minimum rose by 1.76°C. Daily mean temperature did not differ significantly. Together, these results describe buffering of the daily cycle: extremes moved closer together without general cooling throughout the day.
For salmonid habitat assessment, the distinction matters. A similar average can accompany different peak exposures and different time spent at particular temperatures. The Bridge Creek values are neither an expected improvement for another stream nor a safety threshold for a particular species or life stage.
Local cool patches described a different pattern
The 2015 campaign compared 22 monitoring points within a dam complex with ten in an unimpounded reach. Near-bed temperatures were much more varied within the complex. Some locations remained cool while others followed the surface-water cycle more closely. A reach average would conceal that spatial variation.
The authors related these observations to groundwater exchange. Water held in valley alluvial deposits can interact with the stream, depending on local hydraulic conditions. That connection needs to be investigated at the site; the presence of a dam alone does not guarantee a cool groundwater input at every location.
This fine-scale comparison had limitations. Each reach was observed over three days, at different dates in July 2015. This campaign did not follow the same locations before and after dam establishment. It described spatial contrasts consistent with the proposed mechanism, without independently establishing the cause of each cool patch.
Buffering and groundwater exchange are distinct explanations
The researchers proposed that increased surface-water storage helped moderate daily extremes. A larger stored volume can respond more slowly to gains and losses of heat. That explanation does not require a lower daily mean, and is different from continuous cooling by a groundwater input.
Groundwater exchange could contribute to local cooler conditions within a complex. The paper discusses both processes rather than attributing every result to one mechanism. Interpreting it requires keeping the reach scale, individual channel locations and the 24-hour cycle separate. Evidence at one scale cannot automatically answer a question at another.
The term thermal refuge also needs a functional qualification. A cool location may offer potential habitat value, but its temperature alone does not show that fish can reach it, use it or gain a survival benefit. Individual thermal stress was not measured by this analysis of water temperature.
Plan observations that retain time and location
For a site team, a useful starting point is a continuous series with synchronised measurements and precise sensor locations. Depth, periods out of water or buried by sediment, and changes to the channel should remain traceable. Otherwise, a reading affected by the sensor’s condition could be mistaken for an ecological event.
A complementary spatial survey can investigate contrasts near the bed, water inputs and side channels. It needs context from flow, shade and channel form. Dissolved oxygen is another parameter to examine when assessing whether a location is suitable for fish. Cool water by itself is not a complete assessment of environmental or health conditions.
These are proposals for improving an environmental investigation. The American study does not authorise building structures, changing flows or relocating beavers elsewhere. Intervention decisions depend on the site, objectives and applicable procedures. The first transferable lesson from Bridge Creek concerns the questions to ask and the observations needed to answer them.
A monitoring programme should also state what it cannot establish. Temperature records can demonstrate a change in exposure conditions. Claims about occupancy, growth or survival require suitable fish observations and an appropriate comparison. Keeping those evidence requirements separate avoids assigning an unmeasured biological outcome to a physical change.
Assess a thermal regime rather than one number
The study brings time and space into the same assessment. Lower maxima, higher minima and local cool patches describe different changes. Separating them helps teams interpret fish habitats without promising uniform cooling or a biological benefit that the temperature analysis did not measure.
Vetofish can help define monitoring questions and bring water measurements together with animal observations and site history through its advisory and support service. Its work in the aquatic environment sector focuses on interpreting documented evidence and its limits before selecting further investigations.


