

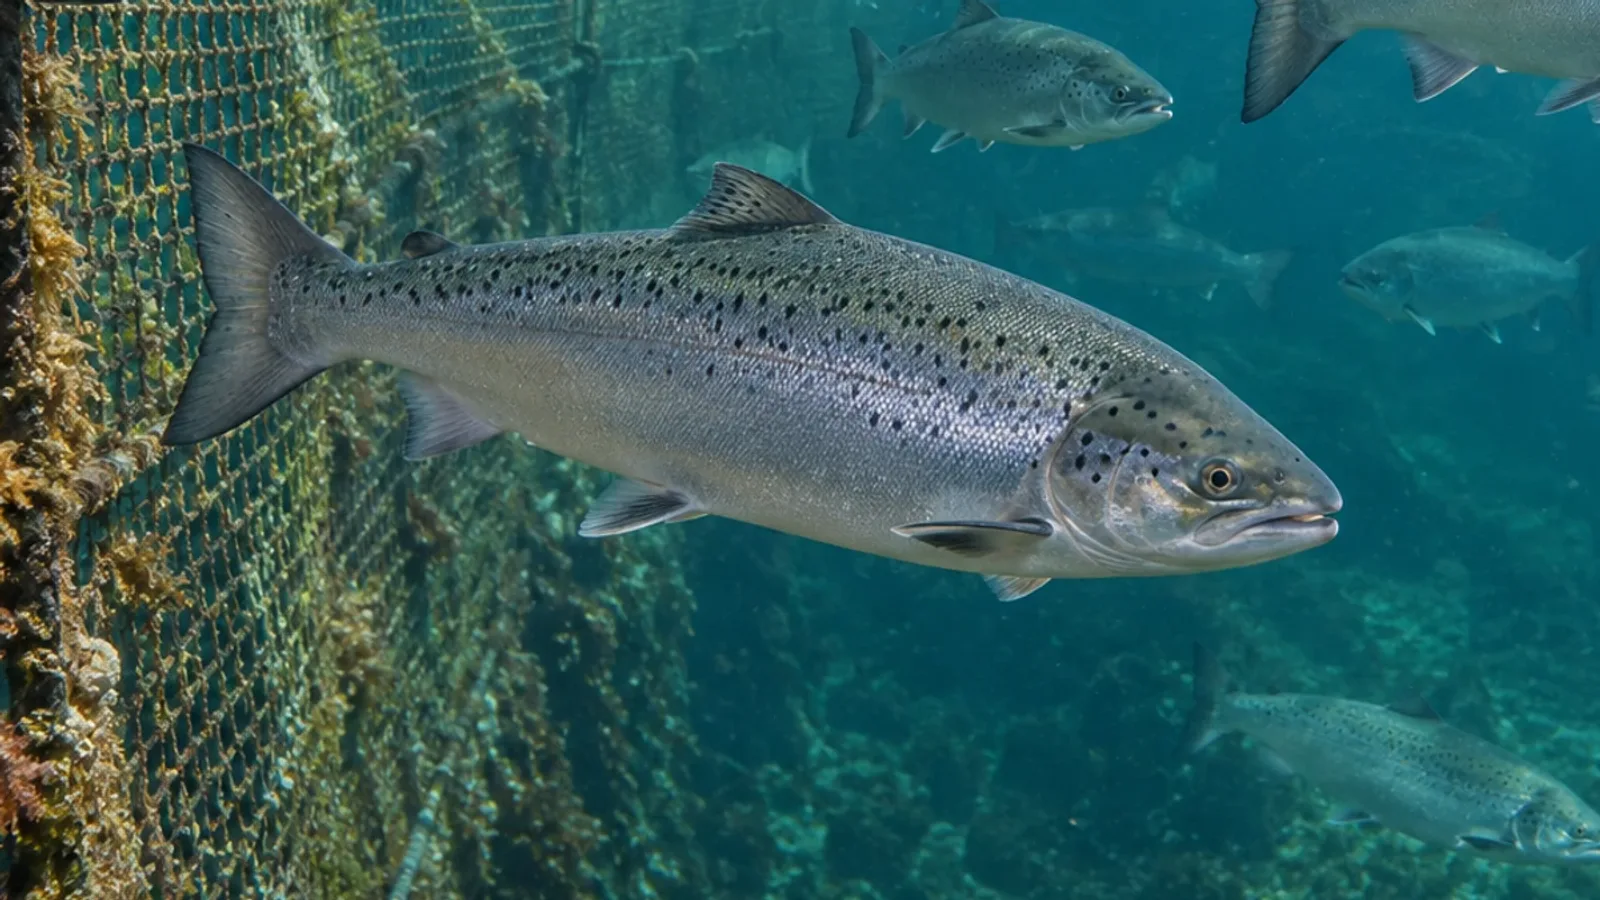
Salmon mortality: connect daily counts with cumulative losses
Small daily death counts can conceal persistent losses. The English 2025 LAKSVEL protocol provides a framework for reading mortality in sea-cage salmon alongside stock records, behaviour and environmental conditions.
- Content type
- Practical guide
- Sector
- Aquaculture
- Animal group
- Salmonids
- Keywords
- StressTemperatureOxygenEthogram
Keep the history behind a mortality figure
Mortality records describe losses from a group of fish, but they do not identify the cause. In an Atlantic salmon cage, a few deaths repeated each day may accompany a persistent problem that looks unremarkable in the latest daily entry. A sudden increase requires immediate attention even when the preceding weeks looked favourable. Effective surveillance needs to preserve both timescales.
The Norwegian Institute of Marine Research published the English LAKSVEL protocol in June 2025. It addresses post-smolt and grow-out Atlantic salmon in sea cages, combining environmental measurements, observations of the group and examinations of individual fish. That framework can help organise farm observations. Norwegian reference levels require interpretation in their original setting and should not become universal thresholds for farms elsewhere.
Establish what was counted and when
Start with a dated observation: how many dead fish were recovered, from which cage and during which collection? Record interruptions to retrieval. Following several days of difficult access, the number recovered may represent deaths accumulated over more than one day. Treating that collection as a precise measure of deaths on its retrieval date can distort the apparent timing of an event.
Keep fish found dead distinguishable from fish removed and euthanised because of health problems. Both contribute to losses, while their separation preserves information about disease and decisions taken for the animals. Changes in recording conventions also need to remain visible. Otherwise, an apparent improvement can reflect a change in classification rather than a change in the health of the stock.
Give cumulative losses an explicit population
Adding death counts across a defined period produces a cumulative number of deaths. Turning that number into an interpretable percentage requires a documented reference population. Stocking, transfers, removals and inventory corrections can all change the group being followed. When fish have been redistributed between cages, the cumulative record needs to retain the history of those movements.
Biomass provides additional context but cannot replace the fish count. The same mass of salmon can represent different numbers and sizes of fish. Comparisons between periods require a consistent convention, an explicit denominator and a clear marker whenever the identity of a group changes. Adding daily percentages calculated from changing populations does not automatically produce a comparable cumulative mortality rate.
Use daily, weekly and production-cycle views together
Daily counts help detect a rapid departure from normal conditions. A seven-day cumulative view makes persistent losses easier to discuss during a health review. A production-cycle total describes losses since a clearly identified starting point. Each answers a different question. A reassuring average must never hide an abnormal day or delay a response to fish in distress.
LAKSVEL presents mortality across different time windows and relates it to fish size and historical Norwegian data. A level commonly observed in those records is not necessarily a desirable biological outcome. An established baseline may still offer scope for improvement. The protocol’s comparisons should support interpretation, rather than become an instruction to wait until a particular number has been exceeded.
Connect the records with observations of living fish
Behaviour and appetite are also group indicators in LAKSVEL. A lasting fall in feed consumption, an unusual distribution of fish or individuals separating from the group can add meaning to a mortality trend. None of these observations independently identifies an infection. They are more informative when the timing and conditions of observation remain reasonably consistent between days.
Temperature and dissolved oxygen need to be considered where the salmon are actually located. A measurement near the surface does not describe the whole cage. The protocol draws attention to changes with depth and time. Connecting fish observations with these profiles can help investigate an environmental explanation, without assigning every death to the most recent sensor reading.
Annotate operations and their follow-up
Capture, crowding, transfers and treatments should have their own entries alongside the mortality record. Handling stress and injuries can affect the subsequent course of the group. Temporal proximity helps frame an investigation, but does not establish that an operation caused every later death. Observations made before the intervention remain part of the evidence.
A useful review brings together the trend, population changes, operations and available health findings. Where sampling is necessary, it should answer a defined question: investigate recent deaths, examine fish with a particular sign or assess how widely a problem is distributed. The accumulated death count cannot determine which fish or tissues will best answer that question.
Decide who reviews the signal
The monitoring plan should identify who checks the records, who examines the fish and who can request veterinary investigation. A table completed regularly but never reviewed has little value as an alerting system. Missed collections, missing measurements and corrected entries deserve attention because they alter the confidence that can be placed in the trend.
LAKSVEL is a basic monitoring framework, with more detailed investigation required when the cause, severity or appropriate response remains uncertain. Low mortality alone does not establish good welfare: surviving fish may have injuries or concerning behaviour. Health decisions need to combine these observations rather than compress the assessment into a single reassuring score.
Conclusion and Vetofish support
Usable mortality surveillance preserves daily events, cumulative losses and the history of the group. It helps recognise a persistent problem and connect an alert with fish, water conditions and farm operations, while keeping a temporal association separate from a diagnosis.
Vetofish can help define recording categories, responsibilities and trend reviews through its advisory and support service, tailored to aquaculture facilities. The purpose is to turn farm observations into information that supports an appropriate health decision for the site.


