

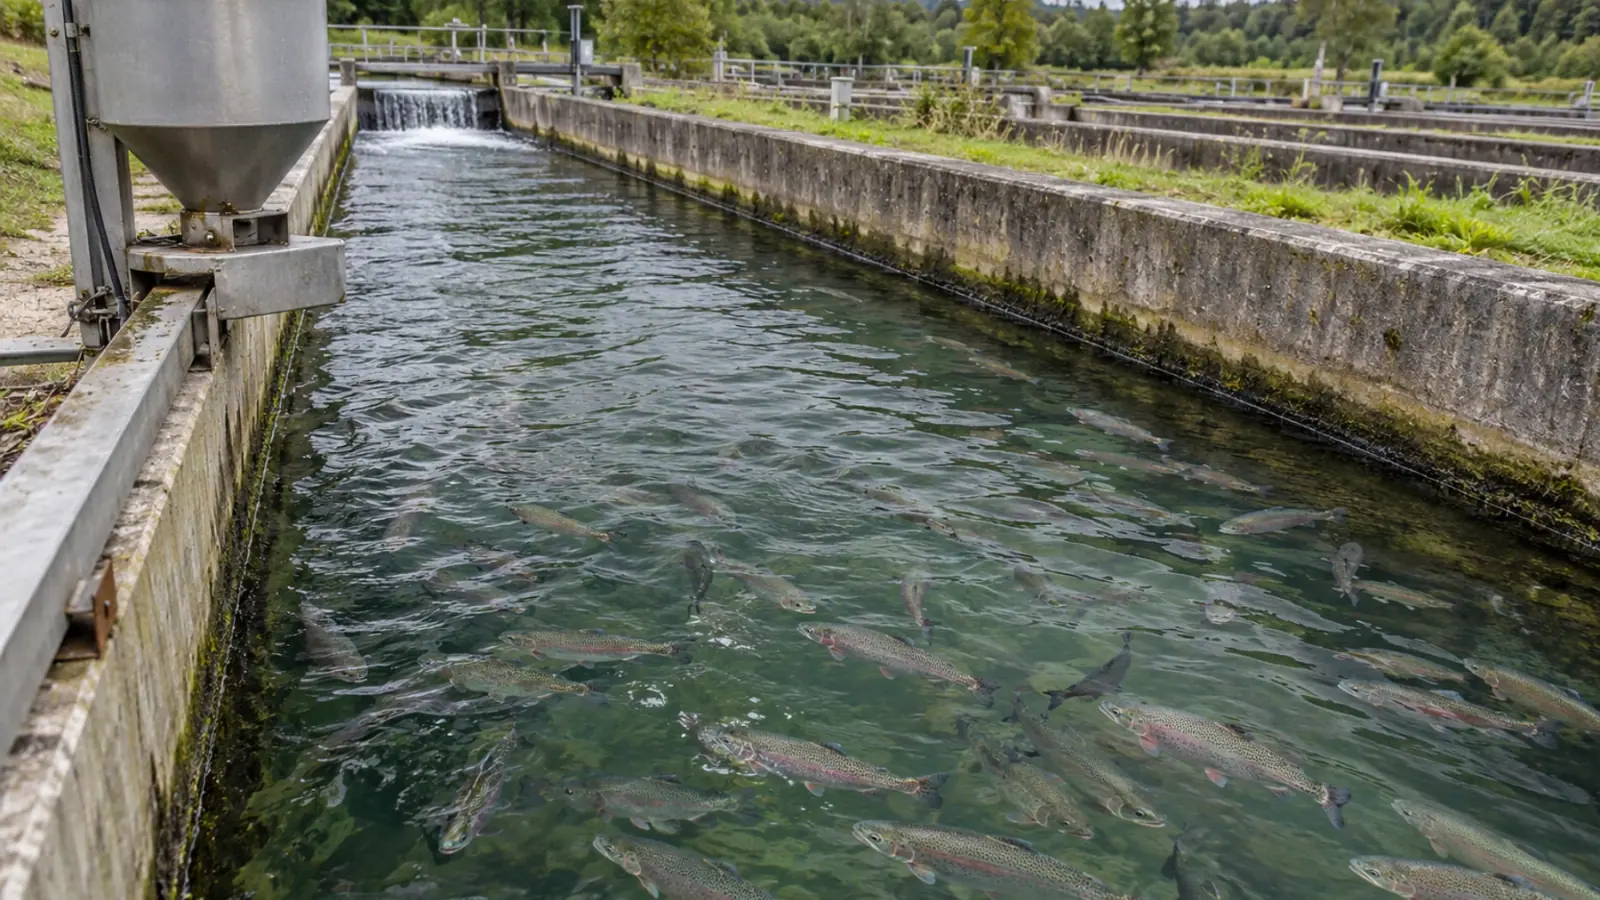
Aquafeed: feed conversion is not the whole carbon footprint
A better feed conversion ratio reduces feed requirements, but says nothing about the emissions from making that feed. Comparing feeds requires actual farm performance, ingredient sourcing and a consistent assessment boundary.


- Content type
- Practical guide
- Sector
- Aquaculture
- Animal group
- Fish
- Keywords
- CO₂TemperatureStress
Start with the definition of feed conversion
Feed conversion ratio, or FCR, expresses the amount of feed used relative to a defined production gain. A lower value means less feed was required for that gain under the conditions assessed. It does not describe the greenhouse gas emissions released when the feed was manufactured. For a farm comparing products, both parts of the calculation matter.
Check what a supplier or farm record actually calls FCR. Does the numerator represent feed delivered, feed distributed or estimated consumption? How is production calculated, and how are stock movements recorded? A number without these conventions can look comparable while answering a different question. Small differences are particularly difficult to interpret when the underlying records are incomplete.
Nutrition remains the starting requirement: a feed must meet the needs of the species and life stage. Environmental comparisons have to retain that purpose. A product should not be judged successful because its reported footprint is low if the comparison overlooks how the animals perform on it.
Connect farm performance to feed emissions
MacLeod and colleagues published a model of global aquaculture greenhouse gas emissions in 2020, using production data from 2017. Their assessment covers nine species groups and follows emissions to the farm gate. Feed production makes a major contribution within that boundary. The finding supports attention to feeding, but does not supply a current footprint for an individual farm or a test of a particular feed.
Ingredient sourcing and manufacturing affect emissions per kilogram of feed. Farm performance affects how much of that feed is required for a defined output. Read the two quantities together. A feed with a better FCR may carry higher manufacturing emissions; a feed advertised as having lower emissions may lose that advantage if farm performance deteriorates.
Greenhouse gas results are commonly expressed as carbon dioxide equivalents. They do not describe every environmental consequence of an ingredient or feeding strategy. Resource use, nutrient losses and animal health require separate evidence. Keeping those questions visible helps a farm recognise a trade-off instead of hiding it inside a single environmental score.
Check whether the performance evidence fits
Digestibility concerns the proportion of nutrients available for absorption after digestion. It helps explain feed use, but is not itself a carbon footprint. Nor does a result from one feeding trial guarantee the same performance at every fish size, water temperature or health status. The relevant question is whether the evidence fits the animals and operating conditions of the farm considering a change.
Record the context around a feed switch: stock stage, water conditions, feeding arrangements and health observations. Changes in appetite during stress or a water quality problem can alter the apparent outcome. Blaming the formulation immediately may lead to a purchasing decision while the actual cause remains unresolved.
Feed records also deserve attention before comparing products. Purchased quantities, stock balances and distributed feed are different entries. Storage losses or uncertain distribution records can obscure performance before any biological explanation is needed. Reconciling these records is often more informative than comparing precise-looking ratios from incompatible systems.
Keep the production denominator consistent
Biomass is the total mass of fish within a defined group. Its change reflects growth alongside arrivals, transfers, harvests and losses. A meaningful comparison needs to state which of these movements contribute to the production figure. Using the same time window is essential: a partial feeding period should not be matched casually with a different production interval.
Mortality changes the interpretation too. A biological calculation may account for the mass of fish subsequently lost, whereas a commercial output measure excludes fish that are never sold. These are useful but different perspectives. Mixing them can conceal differences in health outcomes and emissions per unit of marketed product.
A practical comparison sheet can contain the FCR definition, assessment period, production measure, feed quantity, health context and supplier footprint method. Missing information should remain visible. It should not be silently treated as zero, and uncertainty should not disappear simply because a spreadsheet produces several decimal places.
Compare assessment boundaries before rankings
The global model groups species and uses assumptions about feed and energy, among other inputs. Its estimates carry uncertainty and exclude stages beyond the farm gate. A footprint that includes processing or distribution cannot therefore be compared directly with its results. Assessment year, sourcing regions and the treatment of co-products also need to be consistent.
These limitations still allow useful decisions. Ask suppliers for a documented method, a clear reporting unit and the conditions behind a claimed improvement. Where the ranking depends strongly on an uncertain assumption, retaining alternative scenarios is more defensible than declaring one feed universally preferable. A global estimate can guide the questions without replacing farm evidence.
Protect feeding quality while reducing losses
The 2025 European code of good practices on fish welfare recommends adapting feeding to species biology, life stage and farming conditions. It also emphasises access to feed and avoiding feeding practices that damage body condition. This is technical guidance; it should not be presented to international readers as a new French legal requirement.
Reducing rations solely to improve an indicator can undermine these aims. Review feed efficiency alongside fish condition and a footprint calculated within a stated boundary. FCR remains useful when its definition is clear and the health context is retained. It cannot establish the carbon performance of a feed on its own.
Vetofish can help your team reconcile feeding records, fish observations and supplier documentation. That work can identify where a comparison is usable, where assumptions remain influential and what evidence is needed before changing feed or distribution practices.
To move from evidence to action, explore our advice and support service and our expertise in aquaculture.


