

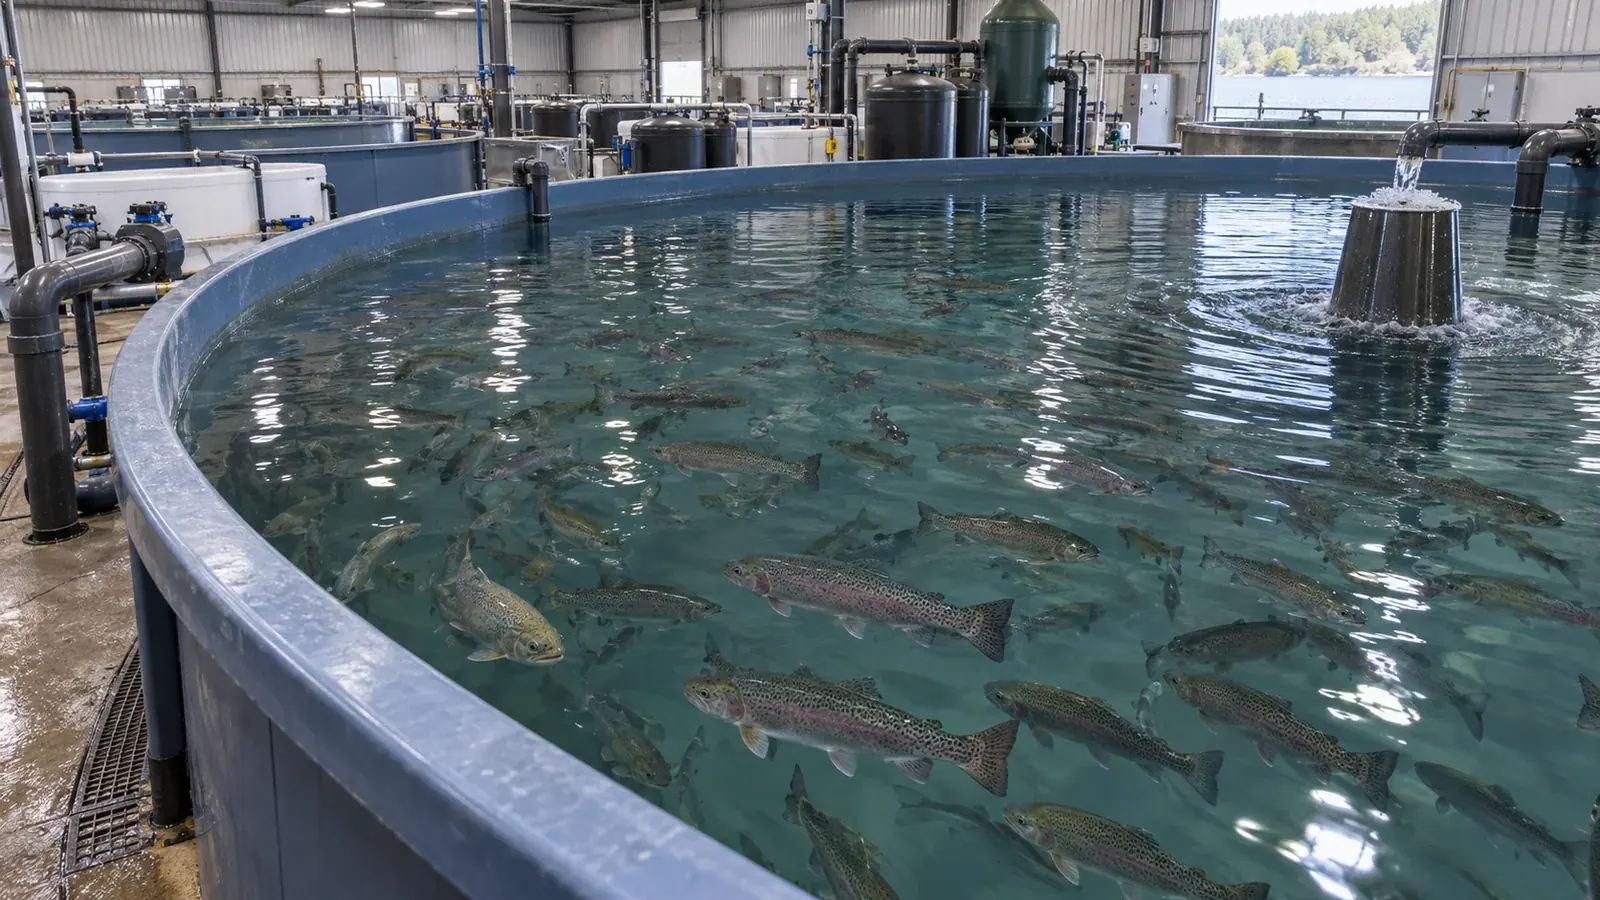
RAS energy use: compare like with like
Two recirculating farms can report very different electricity use without one necessarily being less efficient. System boundaries, biomass, time and treatment level must first be made comparable.
- Content type
- Scientific news
- Sector
- Aquaculture
- Animal group
- Fish
- Keywords
- OxygenTemperatureCO₂
A recirculating aquaculture system uses electricity to move, oxygenate and treat water. That fact alone does not make two facilities comparable. A systematic review published in 2026 found that studies used different system boundaries and denominators. A value per kilogram of fish, per cubic metre or per day answers a different question. Meaningful benchmarking therefore starts by reconstructing what each figure includes.
RAS does not define one energy boundary
Some studies count only pumps on the main loop. Others also include oxygenation, heating or cooling, ultraviolet treatment, ozone, lighting, feed production, buildings or effluent treatment. Klatt and colleagues retained 22 quantitative studies, but those differences restricted direct comparisons.
The first practical task is to draw the boundary. A site-wide meter captures the bill, yet it rarely identifies the equipment behind a change. Submeters for pumping, oxygen delivery, temperature control and water treatment make the result actionable. Records should also say whether on-site generation, backup equipment and start-up phases are included.
The electricity mix does not change the number of kilowatt-hours used. It does change the associated carbon footprint. Energy demand and greenhouse-gas intensity should remain separate indicators so that a change in one is not mistaken for a change in the other.
Energy per kilogram depends on the production cycle
Kilowatt-hours per kilogram sold can support an economic comparison. It is also affected by growth, mortality, cycle length and the biomass actually held. A lightly stocked research system may appear highly energy intensive per kilogram because its purpose is experimental control rather than commercial output. Conversely, high stocking density can spread fixed demand across more biomass without proving that a system is better designed or more resilient.
The 2026 review found that commercial systems generally reported lower energy use than research facilities, while freshwater systems tended to use less than marine systems. These patterns describe the available studies; they do not establish a universal ranking. Species, salinity, target temperature, water-quality requirements and biosecurity can all alter demand.
A useful dashboard therefore combines several views: total kilowatt-hours, energy per kilogram produced, energy per kilogram of standing biomass over time, and production achieved. Operating hours and flow measurements for major equipment help distinguish a change in biological load from a loss of mechanical efficiency.
Lower flow is not automatically more efficient
Pumping is often a major load. Demand depends on flow and head as well as friction through pipes, bends, valves and filters. A clogged filter or poorly sized pipe can increase effort without an obvious change in useful flow. Measuring power, flow and pressure together can reveal that drift.
Reducing flow solely to improve the energy figure can impair solids removal, oxygen delivery or water stability. The decision must remain tied to biological needs and treatment capacity. A saving that increases exposure to ammonia, carbon dioxide or unsuitable temperatures transfers the cost to fish performance and welfare.
Oxygenation requires the same care. Demand changes with biomass, feeding, activity and temperature. A stable set point does not mean stable consumption. Electricity records should be compared with dissolved-oxygen profiles, feed inputs and peak periods rather than judged against a universal number detached from the species and system.
Capture representative operating periods
A spot reading might be taken after filter cleaning, during a low ration or in unusual weather. It cannot represent the production cycle. Monitoring needs to cover changes in biomass, season, temperature and maintenance. Shutdowns, alarms and equipment replacement belong in the history because excluding them can hide the cause of a high value.
At a minimum, comparisons between sites should record species and life stage, useful water volume, mean and maximum biomass, production, feed input, temperature, salinity, flows, treatment processes and observation period. A common table does not eliminate biological differences, but it exposes them before the figures are ranked.
Research systems also deserve a stated purpose. An installation maintaining separate experimental groups, redundant life support or unusually stable temperatures may use energy that cannot be removed without changing the research question. Commercial and experimental units should not be placed on the same league table without that context.
Turn a benchmark into a decision
Published evidence remains heterogeneous, and the systematic review highlights the shortage of standardised commercial data. Its immediate value is to prevent false comparisons. One farm may use more electricity because it heats cold source water, treats seawater or operates at low biomass. Another may look efficient because some loads sit outside the reported boundary.
The most defensible approach is to establish a local baseline and track departures under comparable production and environmental conditions. A persistent increase should prompt checks of filter loading, head loss, pump efficiency, leaks, control settings and maintenance timing. Any intervention should then be assessed alongside water quality, growth, mortality and welfare.
Vetofish can help recirculating farms define indicators, review equipment performance and interpret energy, production and health records together. The goal is not a favourable headline figure but a measurement precise enough to guide change without compromising the animals.
To move from evidence to action, explore our advice and support service and our expertise in aquaculture.


