

Lake Geneva quagga mussels: read monitoring by depth
Lake Geneva’s 2024 monitoring combined sediment grabs and lake-bed images. Quagga mussel distribution varied strongly with depth, but two surveys cannot establish the invasion’s long-term trajectory or describe areas outside the sampling frame.
- Content type
- Practical guide
- Sector
- Environment
- Animal group
- Corals and invertebrates
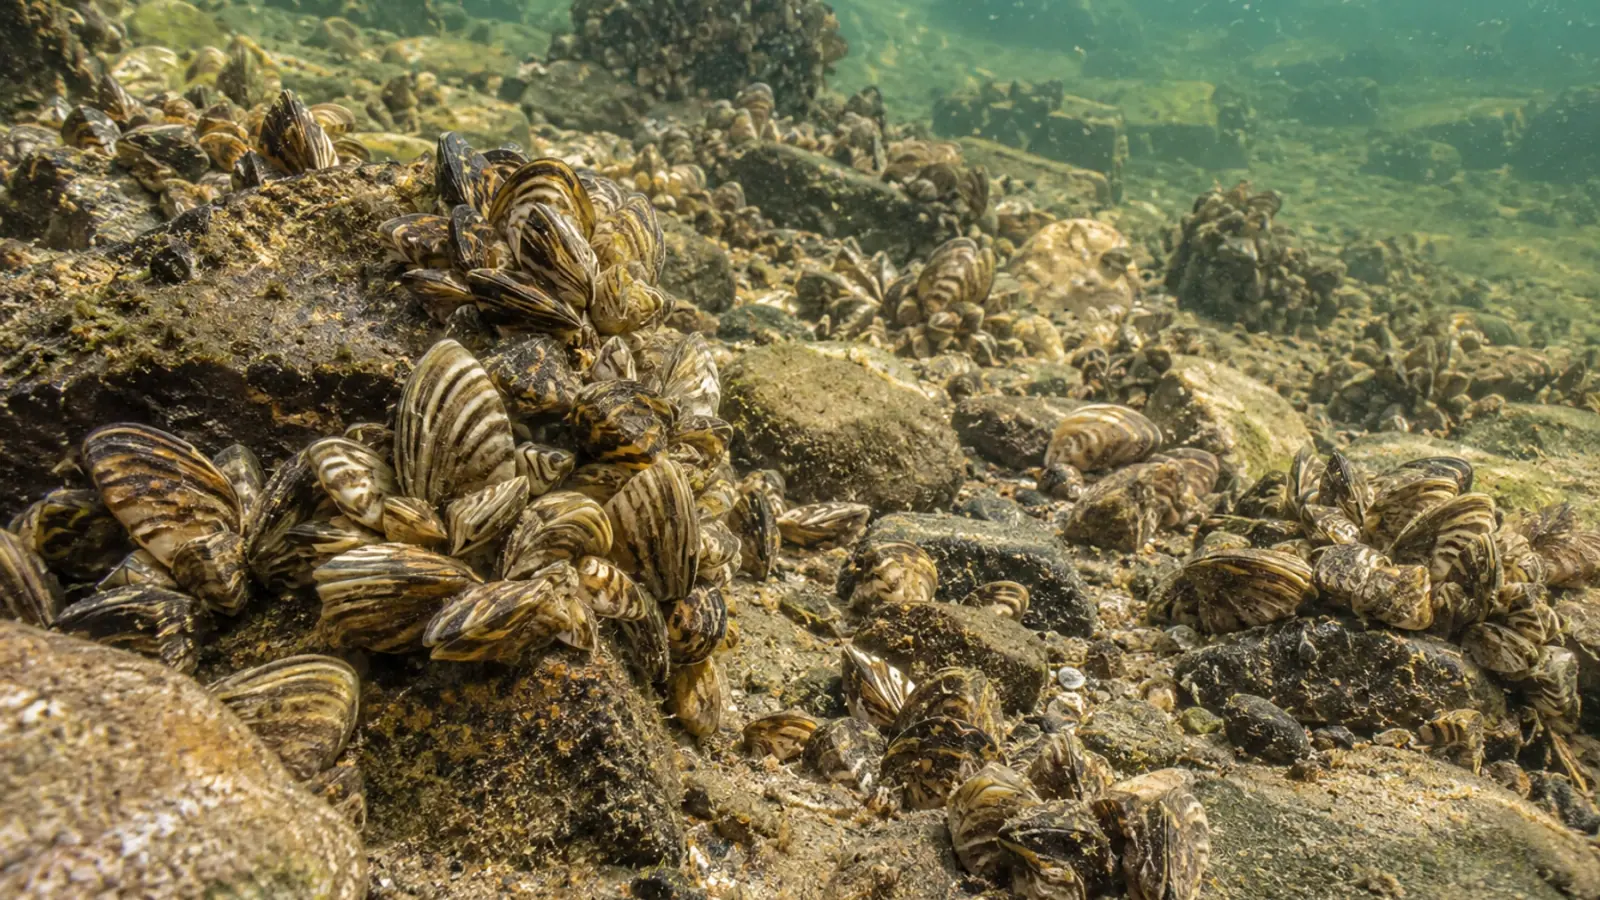
A photograph of densely packed mussels near a shore cannot describe an entire lake. Conversely, low densities in deeper water do not establish that water intakes or littoral habitats face little exposure. The CIPEL report on Lake Geneva’s 2024 survey makes this difference in scale visible.
The subject is the quagga mussel, named Dreissena rostriformis bugensis in the report. This preliminary account compares the 2022 and 2024 surveys. Those are dated observations, rather than a new complete distribution map produced in November 2026. Keeping the survey year attached prevents a historical dataset from acquiring an unsupported appearance of currency.
Seventy-two sites across the depth gradient
The June 2024 campaign covered seventy-two sites arranged along transects, from ten to three hundred and nine metres deep. Sediment grabs were combined with benthic imaging. Three grab samples were collected per site, while photographs were used to estimate the proportion of the visible bed covered by mussels.
The upper ten metres of the depth range were not surveyed because the vessel could not access those areas. This access constraint is part of the evidence. The survey describes its sampling frame, not every shoreline habitat. That distinction is especially relevant when asking where another species might persist outside the sampled area.
Collected mussels were counted and measured. Density was calculated as individuals per unit area. Organic biomass was estimated using a model linking shell length with ash-free dry weight, developed from earlier material. It should not be confused with fresh mass directly measured at every location across the lake.
Images and grabs answer different questions
A grab provides material that can be counted within a sampled area. A photograph provides visible coverage within a defined frame. Coverage percentage and numerical density are therefore complementary measurements, rather than interchangeable expressions of exactly the same quantity. A comparison should preserve the method used to obtain each value.
Four sites lacked imagery suitable for sufficiently precise coverage measurement. That analysis consequently used sixty-eight sites rather than seventy-two complete image datasets. Missing values and their reasons belong in the monitoring record. Removing them without explanation would give later readers a misleading impression of uniform sampling success.
Mussels were abundant in shallower sampled areas, with density decreasing at greater depth. No individuals were observed beyond two hundred and fifty metres in the reported grabs. This finding does not establish a universal physiological depth limit for the species, because a field non-detection depends on where and how sampling occurred.
Keep local non-detection separate from disappearance
No living zebra mussels were identified in the reported 2024 samples, although zebra mussel environmental DNA remained detectable. The authors emphasise that areas shallower than ten metres were outside the survey. They therefore do not conclude that zebra mussels have disappeared from Lake Geneva as a whole.
For managers, the lesson concerns the scope of evidence. Molecular detection and adult specimens do not necessarily describe the same form of presence. Comparing them requires locations, dates and detection limits, rather than simply treating a positive result and a negative one as contradictory answers to an identical question.
Identification also matters. Dreissenid shells vary, and the survey used features including the ventral suture to distinguish species. A distant image of a mussel bed cannot identify every specimen. The generated illustration accompanying this article is contextual; it is not intended as a diagnostic identification key.
Two surveys do not fix the invasion trajectory
The 2022–2024 comparison did not show a significant increase in average density across the studied area. The report also discusses shell size and biomass. Stable mean density does not imply unchanged conditions at every station, or establish that ecological consequences have reached a stable endpoint.
Relationships with temperature and dissolved oxygen are field associations. Depth, resource availability and colonisation history may vary together. These relationships do not provide an environmental treatment instruction or a safe operating threshold for infrastructure. Their interpretation needs a design capable of separating the explanations being considered.
Phytoplankton filtration provides a mechanism for asking questions about food-web change. A mussel survey does not, on its own, quantify a decline in fish caused by the invasion. Plausible ecological consequences should remain distinct from effects demonstrated locally with suitable measurements and comparisons.
Connect the survey to the decision
A programme concerned with a water intake may need stations near the installation, whereas ecosystem monitoring aims to represent habitats and depths. These objectives can complement one another without either automatically replacing the other. The area, variable and management decision should be defined before a dataset is used to justify action.
Equipment biosecurity remains relevant when teams move between sectors or lakes. Planning operations and keeping equipment histories can reduce the chance that monitoring itself becomes an opportunity for unintentional transport. No chemical treatment of the lake or new legal obligation is proposed in this article.
A depth-based account with explicit boundaries
The report offers a documented picture of the sampled areas and a basis for subsequent comparison. Its value depends on retaining its boundaries. Continuing the series and explaining absent areas is more informative than reducing the lake to one image or declaring a definitive long-term trend from two dates.
Vetofish advisory support can help connect objectives, sampling and interpretation. For aquatic environment managers, the purpose is monitoring proportionate to the ecological and animal-health decisions facing the site.


